
How to Test Whether Your Brand Search Ads Are Incremental
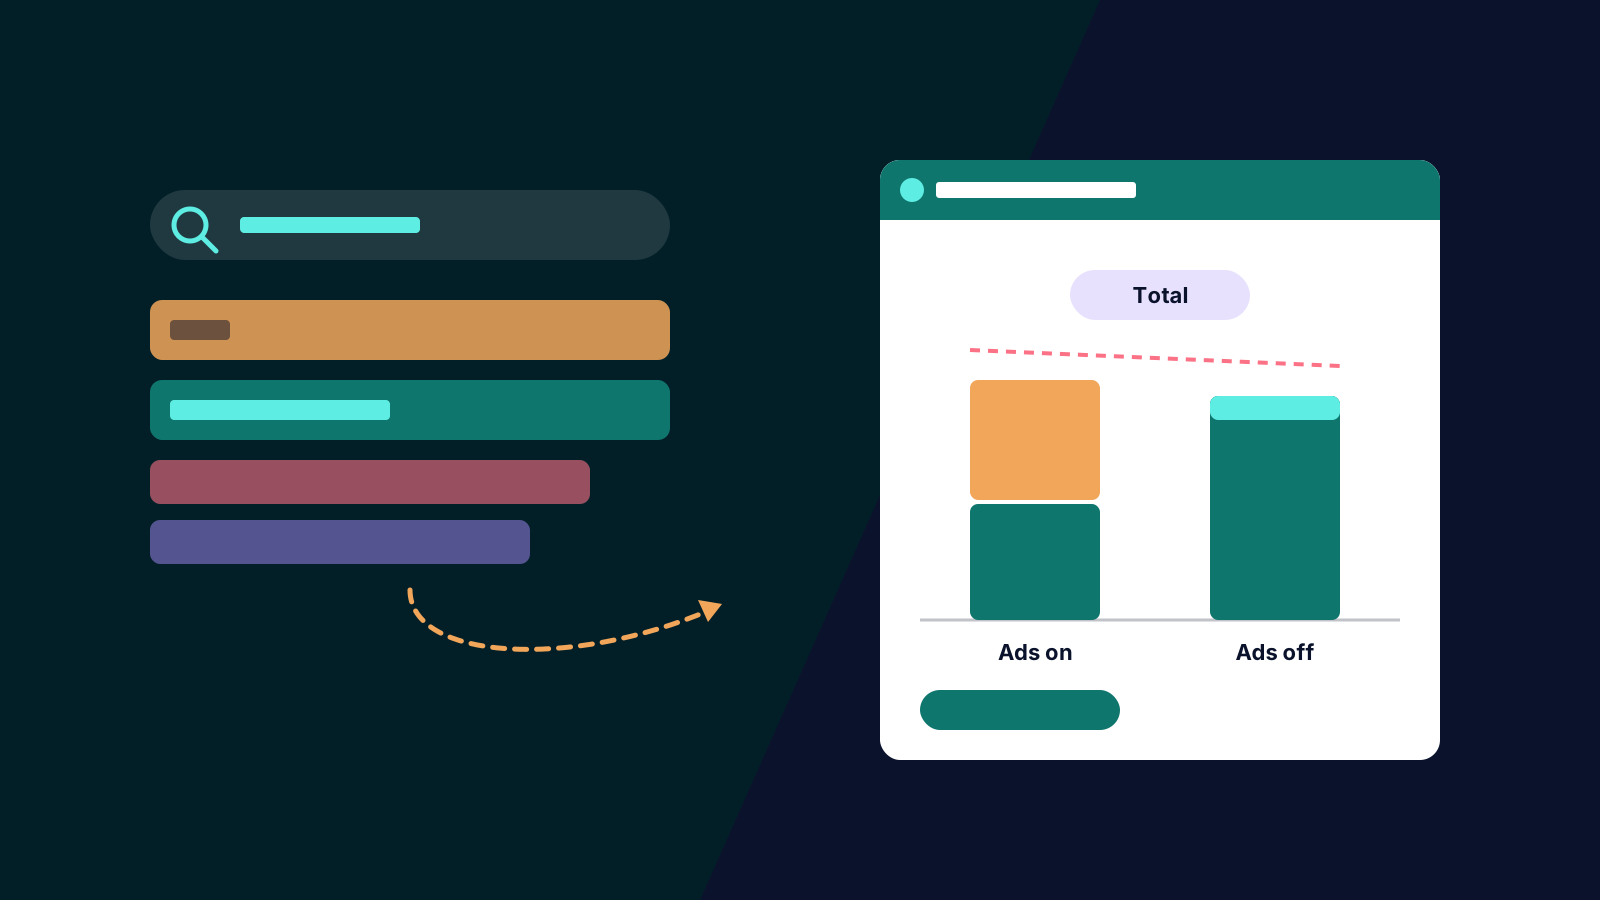
Most brand search debates end with someone saying "we should test it", and then nobody does, because switching off the best-looking campaign in the account feels reckless. It is not reckless if the test is designed properly. It is reckless to keep paying for clicks you might get free without ever checking.
We covered the evidence and the decision framework in should you bid on your own brand. In short: Google's own meta-analysis of paused campaigns found 89% of ad clicks were incremental on average, but a follow-up study put that at roughly 50% when the advertiser also held the top organic result, and both measured clicks rather than sales. Your number depends on your brand, so this piece is the method for finding it.
Build the Baseline First
Before touching a campaign, pull at least eight weeks of history, split by week and by region if you plan a geo test:
- Paid brand clicks, cost and conversions from Google Ads, using a clean brand campaign or label.
- Organic brand clicks from Search Console's performance report, filtered to brand queries. Search Console reports by country, not by state, so for regional splits use GA4 organic search sessions that land on brand entry pages as the proxy.
- Total brand conversions and revenue across paid and organic together, ideally from GA4 or your order system rather than the ad platform.
- Auction insights for the brand campaign: who appears on your name, their impression share and overlap rate.
The baseline tells you the weekly noise. If total brand conversions swing 15% week to week, a test that hopes to detect a 5% change needs either more time or more regions.
Choose the Design
A geo holdout is the stronger option: switch brand ads off in a set of matched regions, leave them running elsewhere, and use the running regions as the control. It handles seasonality automatically because both groups live through the same weeks. Our guide to designing a geo holdout test covers region selection and sizing. It fits national brands with enough volume in each state or metro area.
A time-based test fits smaller accounts or single-market businesses. Rather than one long switch-off, alternate periods (two weeks on, two off, two on, two off) so that a single holiday or promotion cannot carry the result. It is weaker than geo because nothing runs in parallel, so keep everything else in the account still, as we stress in running trustworthy Google Ads experiments.
Either way, the success metric is decided now and written down: total brand clicks and total brand conversions, paid plus organic. Paid conversions will fall when paid ads stop; that tells you nothing. The question is whether the total falls.
Run It Without Fooling Yourself
Plan on four to eight weeks of test period, longer if the baseline is noisy. Timing matters more than duration. With Black Friday (27 November), Cyber Monday and Christmas weeks away, we would not start a brand test now: demand, competitor behaviour and promotional intensity all shift week to week, and conquesting peaks exactly when you have stepped away. Plan for February, once the January sales have settled, and use the peak to build the baseline. Our peak season guide covers what to do with brand in the meantime.
During the test, check auction insights weekly on the brand campaigns still running, and spot-check your brand results page in test regions. Agree a kill switch before launch: in our experience, if a competitor appears consistently above your organic listing, or total brand conversions in test regions run more than an agreed threshold below control for two consecutive weeks, ads go back on and the test is recorded as "incremental, at least partly".
Read the Result: A Worked Example
Take a geo test where control regions grew 4% between baseline and test periods, so test region expectations are baseline plus 4%. Paid brand conversions in the test regions were 500 of the 800 total in the baseline.
| Test regions (4 weeks) | Baseline | Expected (+4%) | Actual, ads off |
|---|---|---|---|
| Paid brand clicks | 10,000 | 10,400 | 0 |
| Organic brand clicks | 6,000 | 6,240 | 13,400 |
| Total brand clicks | 16,000 | 16,640 | 13,400 |
| Total brand conversions | 800 | 832 | 728 |
Total clicks fell 3,240 short of expected, so 31% of the expected 10,400 paid clicks were incremental. Conversions fell 104 short of expected, so 20% of the expected 520 paid brand conversions were incremental. If the paid clicks would have cost AUD 6,240, the platform's reported cost per conversion was AUD 12 (6,240 divided by 520), while the true cost per incremental conversion was AUD 60 (6,240 divided by 104).
That AUD 60 is the number to compare with your other channels. Whether to keep, trim or restructure brand coverage from there is the framework in the earlier post, and the same arithmetic underpins our wider guide to paid search incrementality.
If you would like the test designed, run and read for you, it is core work for our incrementality testing team. Get in touch.